 ,
Sebastian Kosch ,
Fabian Steuer ,
Hoagy Cunningham
,
Sebastian Kosch ,
Fabian Steuer ,
Hoagy Cunningham
Dmitry Nikulin ,
Sebastian Kosch ,
Fabian Steuer ,
Hoagy Cunningham
This project was completed during AI Safety Camp 3 in Ávila, Spain, in May 2019.
Advances in deep learning are enabling reinforcement learning (RL) agents to accomplish increasingly difficult tasks. For instance, relatively simple machine learning agents can learn how to beat humans in video games, without ever having been programmed how to do so. However, agents sometimes learn to make correct decisions for the wrong reasons, which can lead to surprising and perplexing failures later. In order to diagnose such problems effectively, the developer needs to understand how information flows through the artificial neural network that powers the agent's decision-making process.
One approach to visualizing how complex models operate on image inputs is through saliency maps. A saliency map is a heatmap highlighting those pixels of the input image that are most responsible for the model output. An example could be a neural network performing an image classification task: given a photograph of a dog in a meadow that was correctly classfied as "dog", a saliency map highlights the pixels the network considers most dog-like. This lets us check whether the network has truly learned the concept of dogs, or whether it merely made a lucky guess based on the presence of the meadow.
To some extent, the methods for generating saliency maps can be repurposed for the analysis of RL agents playing video games, since the agent infers actions (labels) from render frames (images). However, the resulting heatmaps are often blurry or noisy. Furthermore, image classifiers simply detect individual objects, while RL agents must choose actions based on complex relationships between entities detected in the input. A simple heatmap visualization cannot convey whether and where such relationships were detected.
In this work, we present a potential improvement to existing visualization approaches in RL, and report on our experimental findings regarding their performance on six Atari games.
In 2018, Yang et al.[1] explored the effects of adding two attention layers to the decision-making network of an agent learning to play Breakout and other games. The attention layers, applied after some convolutional layers which detect basic game entities, restrict the input to the agent's action selection mechanism to a subset of the input pixels (the attention mask). In effect, this bottleneck forces the agent's model to focus spatially. This can improve sample efficiency, but more importantly, the attention layer activations provide a direct clue about what the model is focusing on. This directness is attractive when compared to post-hoc methods, which require additional computation to reason about the relevance of network activations after inference.
Note that there is no direct correspondence between activated attention layer neurons and relevant input pixels. This is due to the convolutional downsampling layers that separate the input image from the attention layers. However, we can generate a heatmap by backpropagating the attention tensor through the network. Several different approaches exist to accomplish this, from the gradient method introduced by Simonyan et al.[2] to the more recent SmoothGrad[5] and VarGrad[6] sampling methods.
After some experimentation, Yang et al. chose a simpler approach, where they simply visualized the receptive field of the neuron which corresponded to the single strongest activation in their agent's attention layer. Their findings confirm that in trained agents, the attention tends to be strong near crucial entities in the game, i.e. the Pacman sprite or the moving ball in Breakout. However, their attention mask heatmaps are fairly crude.
The effectiveness of attention layers depends crucially on how the attention is constrained. This is especially true in architectures with repeated downsampling, such as Yang et al.'s, where a small but diffuse attention mask will effectively correspond to all input pixels, defeating the purpose of the attention layer.
To incentivize more informative heatmaps than those obtained by Yang et al., we therefore added an extra loss term to represent the diffuseness of the attention tensor. Several options for such loss terms exist; we settled on using the entropy of the final attention layer.
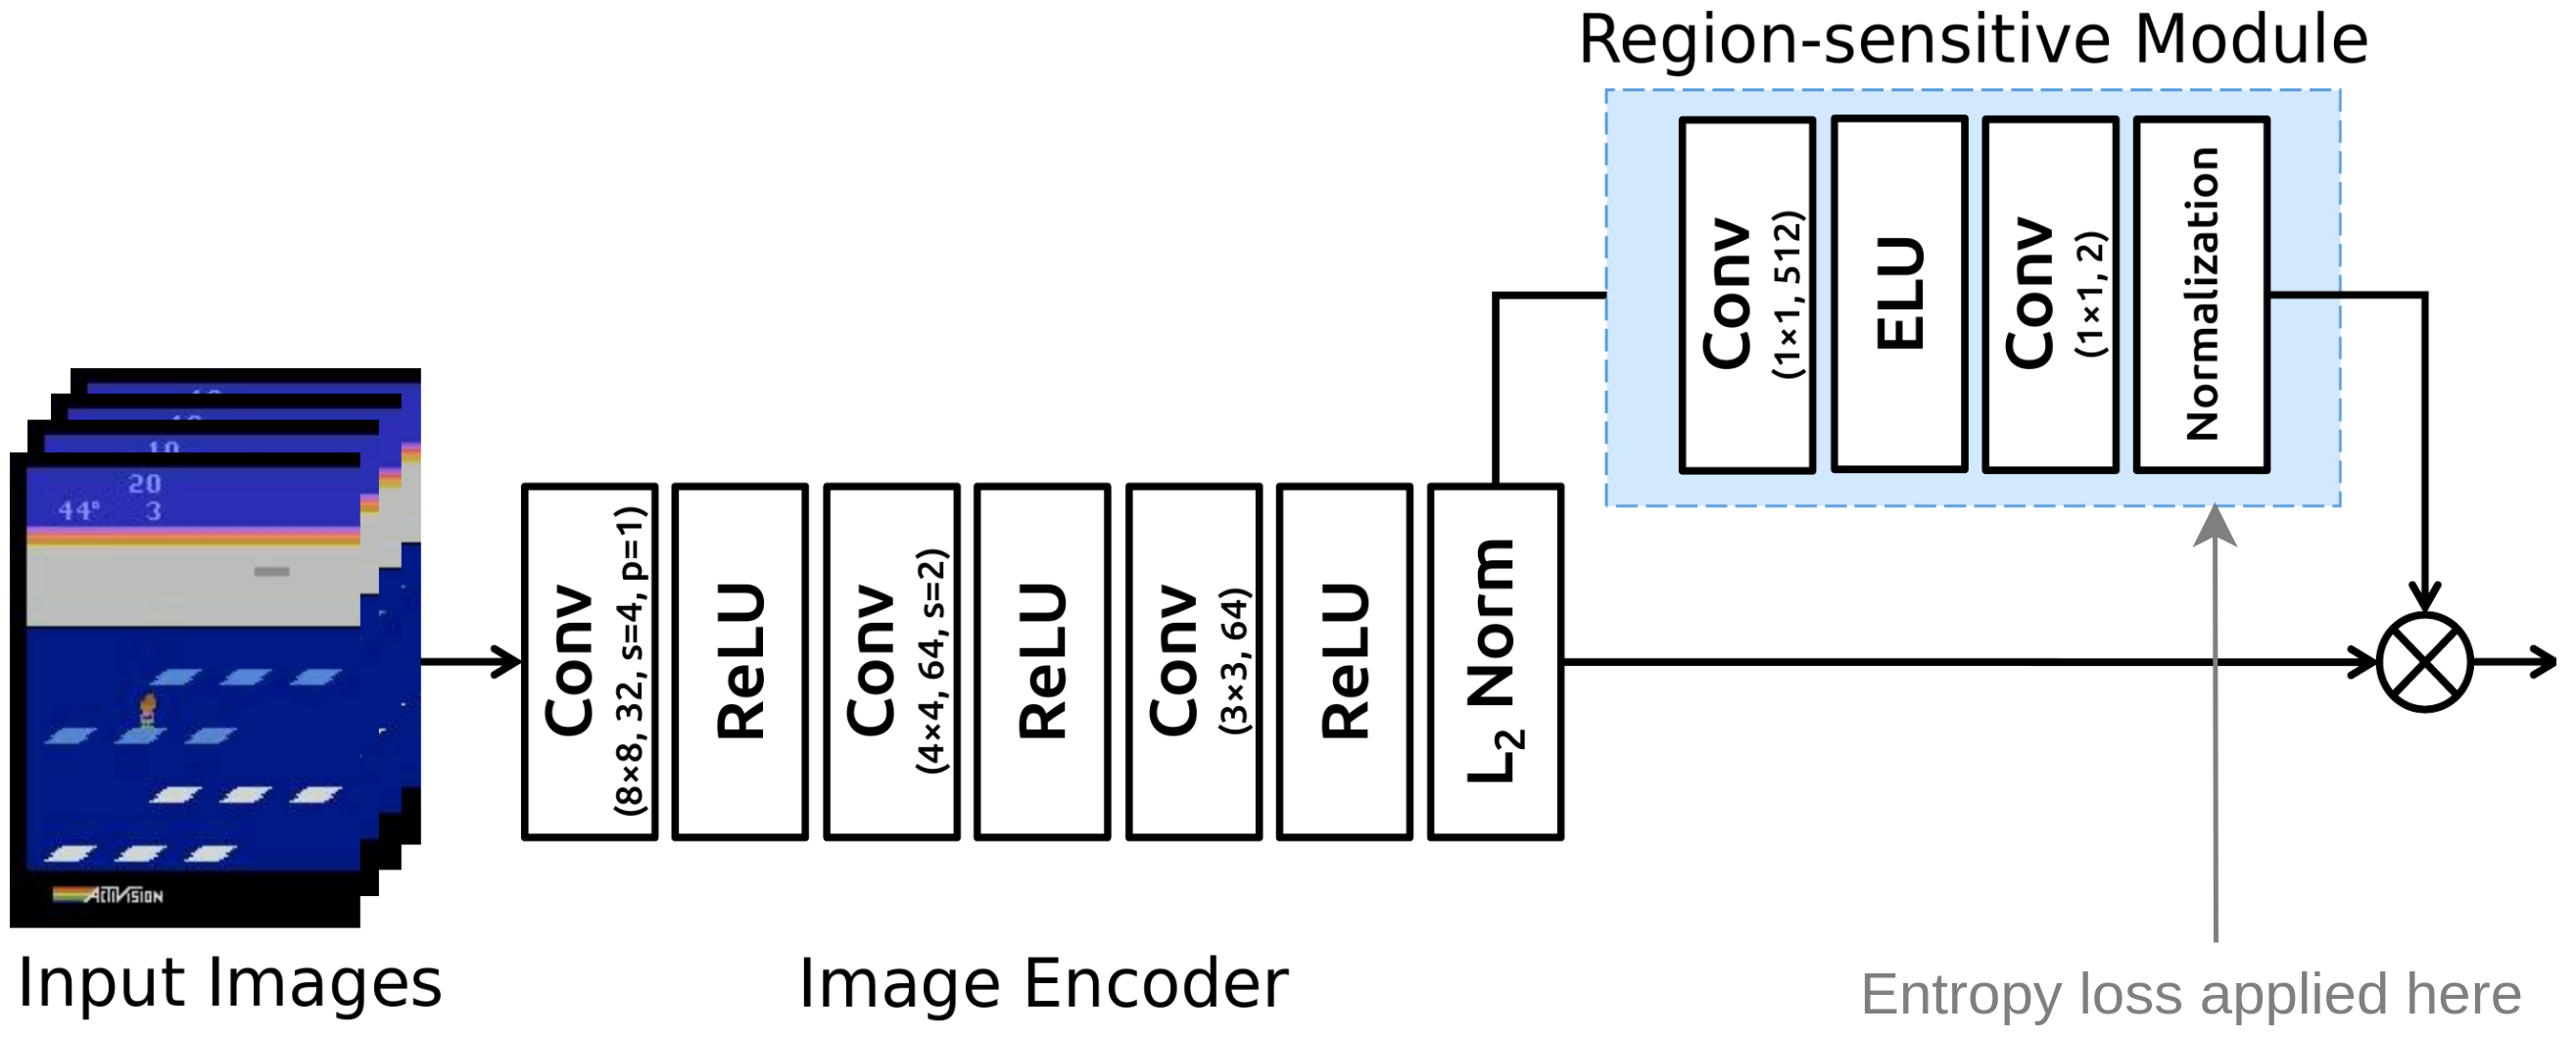
The entropy of the attention mask is a single number that captures whether the attention is spread diffusely across the layer (high entropy) or concentrated in a few locations (low entropy). For our purposes, a high entropy is undesirable, as we wish to constrain attention to only a few locations. In other words, the extra loss term rewards our agent for focusing on only a few locations of the input image, which we can later visualize.
For a discrete probability distribution \(p_i, i=1..n\), entropy is defined as:
\[ \operatorname{entropy}(p) = -\sum_{i = 1}^n p_i \cdot \log(p_i). \]
This quantity is greatest when \(p_i \equiv \frac 1 n\) for all \(i\), i.e., when the probability distribution is perfectly uniform. By contrast, it is equal to zero when \(p_i = 1\) for some \(i\), while the other outcomes have zero probability.
In our case, we regard the output of the attention layer as a probability distribution, and we modify the loss in such way as to minimize the entropy of this distribution. Specifically, we add \(\lambda \cdot \operatorname{entropy}(attn)\) to the loss, where \(\lambda\) is a non-negative coefficient and \(attn\) is the output of the attention layer.
Although attention mechanisms have been shown to improve training times, excessively strong regularization will naturally prevent the agent from taking into account complex relationships between spatially distant entities, and thus degrade performance. We ran a suite of experiments to quantify the impact of entropy regularization on the agent's performance at playing Atari games.
We recreated the agent by Yang et al. in TensorFlow using the
stable-baselines[3] package, a fork of OpenAI's
baselines package with a stable programming interface and
improved documentation. Since stable-baselines does not
include a full implementation of the Rainbow algorithm, we used PPO[4]
as another state-of-the-art algorithm available in the library.
Our experiments show that entropy regularization can be added in such way that its effects on attention maps become pronounced, but performance does not suffer noticeably. The following figure shows average reward agents obtain during training with varying \(\lambda\). The value \(\lambda = 0.0\) means that entropy loss did not affect training. This setup should be regarded as baseline.
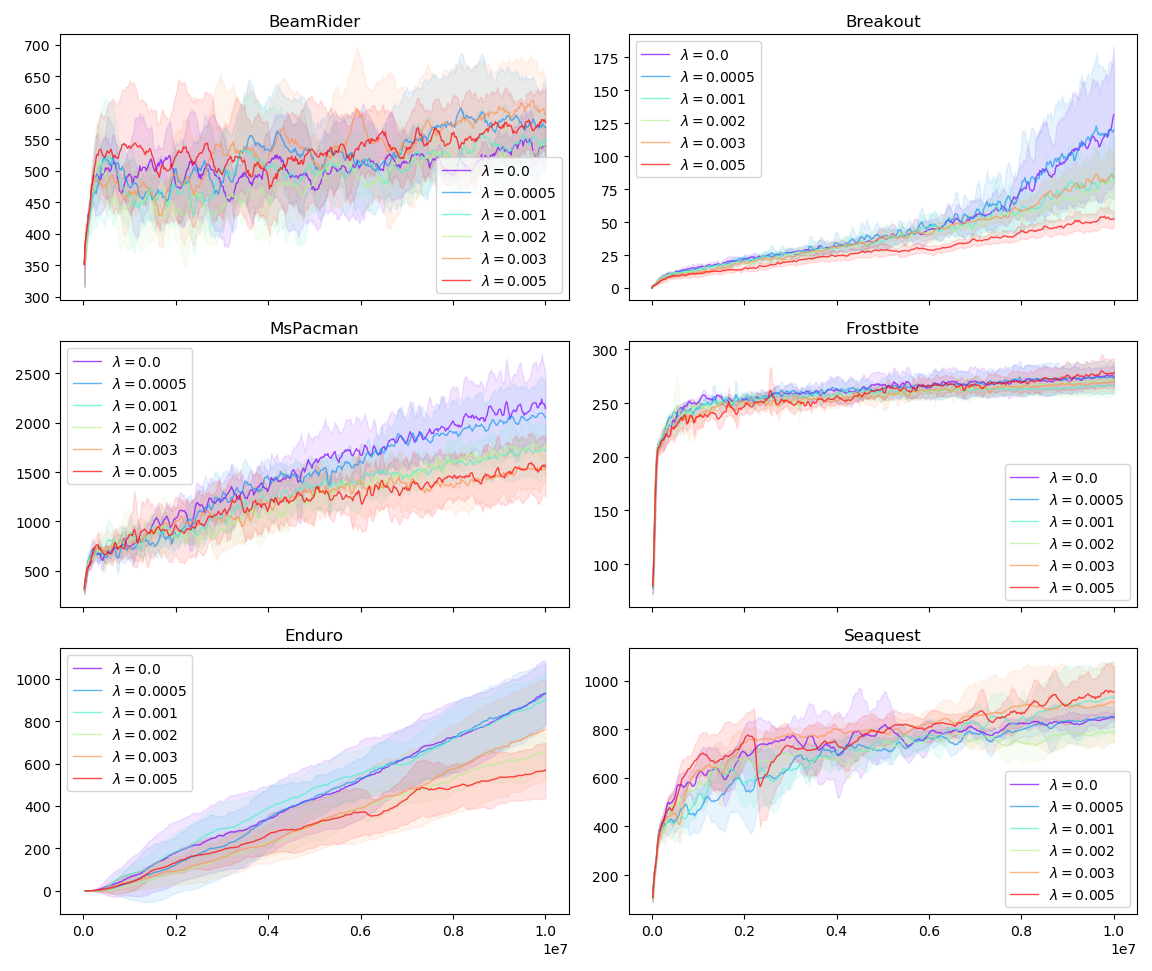
These results are reassuring: in the environments tested, constraining attention with \(\lambda = 0.0005\) does not slow down training, suggesting that we can use entropy regularization to improve our salience visualizations without degrading agent performance. The following figure shows how \(\lambda\) affects the average performance of trained agents:
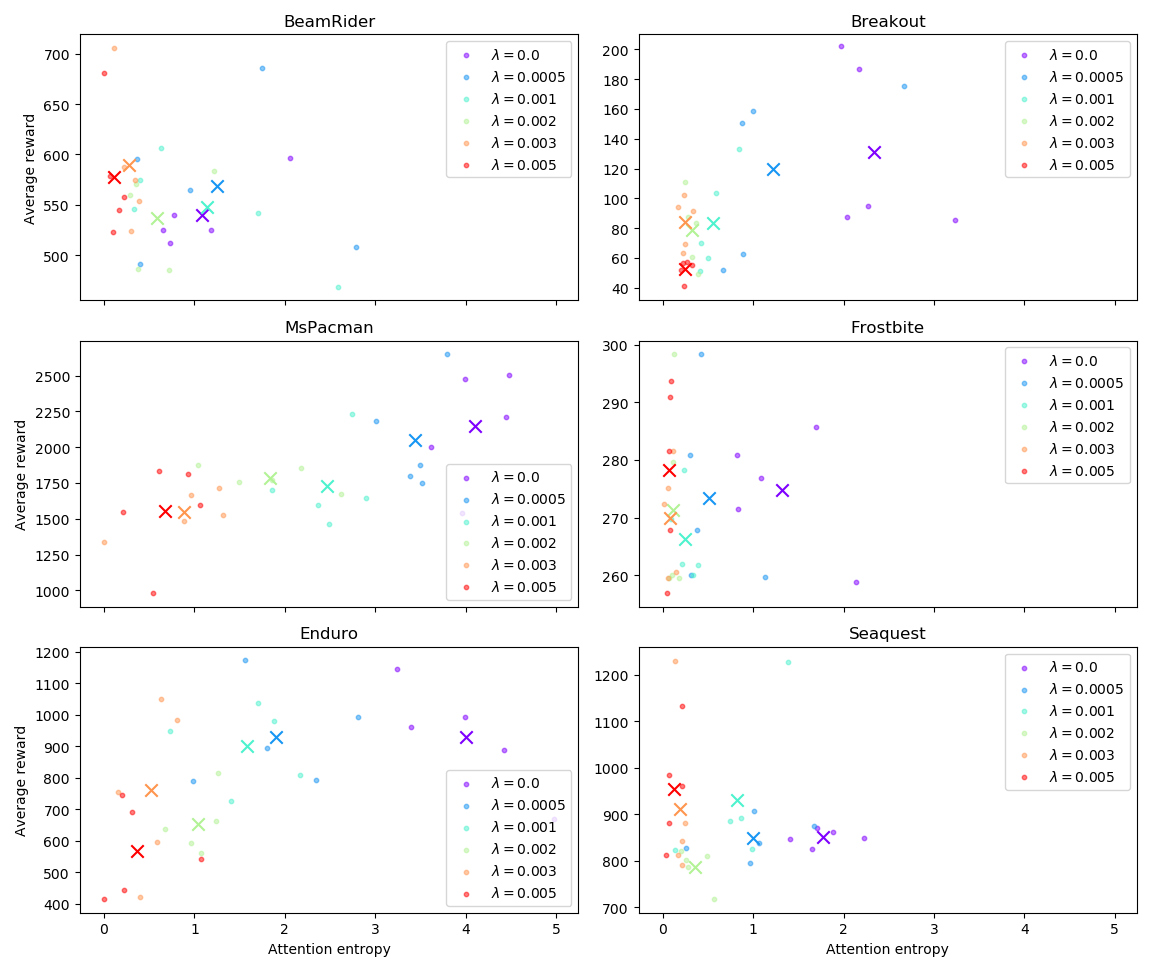
With the exception for BeamRider, it is clear that for the particular case of these Atari games, it is possible to choose a value of \(\lambda\) such that the extra term in the loss will have a noticeable effect on entropy value, without degrading performance.
In BeamRider, none of the agents achieved good performance. This is expected; the authors of PPO report that learning in BeamRider only starts after roughly 10M frames, and we terminated training after exactly 10M frames.
The following videos show what learned attention maps look like for different \(\lambda\).
Entropy regularization ensures that attention masks have a few prominent peaks. Each peak corresponds directly to a particular configuration of features in the underlying convolutional layers. In the entropy-regularized networks, the representation of such feature correlations is often pleasantly sparse, lending itself well to a new variant of visualization via layer-relevance propagation.
Instead of creating a two-dimensional heatmap based on the activation of the entire attention layer, as is commonly done, we chose to focus on only one or a few of the newly-obtained attention peaks. We then recurse through the layers below, picking the strongest associated activations each time, creating a tree structure that represents, at each convolutional layer, the features that contributed most to the attention peaks—and, thus, to the agent's chosen action.
This tree of features can help us understand not only where the most relevant pixels are, but also how these pixels combine to form the features that contributed to the action. The following interactive display shows a selection of four deep branches of the tree structure, and the location of the corresponding features, for a single frame of the Breakout environment.
We select the peaks of the attention layer using a simple peak detection algorithm (more sophisticated approaches, such as k-means clustering with a gap-statistic, proved too slow for interactive visualizations).
Although such visualizations are quite time-consuming to implement in an interactive manner, that effort may be justified. After all, understanding an RL agent's behaviour can be more difficult than confirming that a simple image classifier correctly detected the relevant features.
In comparison, two-dimensional, heatmap-based salience visualizations cannot adequately capture the spatial relationships between entities in the input that are so essential to selecting the correct action. To illustrate this point, we show here the Simonyan gradient, SmoothGrad and VarGrad of the input with respect to the (unregularized) attention layer:
Although SmoothGrad and VarGrad provide a sharper salience map, this advantage quickly diminishes when more samples are used, suggesting that much of the apparent structure is due to the noise in the sampling.
Applying entropy loss to an attention layer in RL agents can help make their policy networks more interpretable by creating better opportunities for deep, layer-based visualizations with sparse, meaningful peaks, rather than the diffuse, population-encoded activity often seen in unregularized attention layers.
We have shown that such entropy-based regularization rarely has a negative effect on agent performance, and can sometimes even improve it, in a variety of Atari environments.
Yang et al. Learn to Interpret Atari Agents↩
Simonyan et al. Deep Inside Convolutional Networks: Visualising Image Classification Models and Saliency Maps↩
Hill et al. Stable Baselines↩
Schulman et al. Proximal Policy Optimization Algorithms↩
Smilkov et al. SmoothGrad: removing noise by adding noise↩
Adebayo et al. Local Explanation Methods for Deep Neural Networks Lack Sensitivity to Parameter Values↩